Think carefully before securing debts against your home. Your home may be repossessed if you do not keep up repayments on your mortgage.
How mortgages work
When buying a house or flat, most of us won’t have enough money saved up to cover the full purchase price. So in order to raise the full amount needed to buy the property, we need to borrow money through a mortgage.
A mortgage is an arrangement where you borrow money from a lender to buy a property, whether as a home or investment (such as a buy-to-let). The term of a mortgage usually lasts between 25 and 35 years.
In exchange for allowing you to borrow this money, your lender will charge you interest. This can be either a fixed rate mortgage where the interest rate remains the same for a specified time, or a variable rate mortgage, where the rate can go up or down.
You’ll usually pay your mortgage off in instalments known as repayments. These are normally required to be made every month.
Mortgage Guarantee Scheme scheme for 91-95% loan-to-value mortgages
Since 2021, the government has been running support in various guises for mortgages where the buyer has less than a 10% deposit to put down. The current Mortgage Guarantee Scheme became permanent in July 2025. Under the scheme, the government can effectively act as a guarantor for a part of the borrowing – promising to pay that part of the debt back if the borrower defaults. The hope is that it'll be viable for banks to offer 95% loan-to-value (LTV) mortgages (which had previously disappeared from the market). The government only offers this to first-time buyers and home movers where the value of the property is no more than £600,000, and it's not a new build. You don't need to do anything – the lenders simply build the scheme into their products. Learn more about the scheme.
What to consider before applying for a mortgage
Get to know your credit record. You can get a copy of your credit report for free online. This is one of the main things lenders look at when deciding whether or not to offer you a mortgage (and what rate to offer you). While improving your credit score takes time, there may be some relatively quick wins open to you. By getting familiar with your credit situation, you’ll have a better idea as to whether it’s a factor that’s helping your chances or holding you back.
Work out what you could afford to pay each month. Taking into account your income and your outgoings, what sort of sum would be affordable for you each month? This is one of the main things that mortgage lenders will be evaluating. If you’ve done your homework and are confident you’d be able to comfortably manage the repayment schedule you’re applying for, there’s a good chance that a lender would come to the same conclusion.
Where is your deposit coming from? All lenders will want to see where your deposit is coming from and whether it is a gift or part of your savings. For example, if the money is coming from your savings account then you will be required to show bank statements as evidence.
Have all your proof of income ready. Your lender will want to know how much you earn, so it is a good idea to have your proof of income readily available for your application. You may be required to present your latest 3 months payslips/bank statements, or your latest P60. The documents you will need to supply depends on the requirements of the specific lender.
Check your solicitors are on the lender’s panel. Lenders these days are extra careful about which solicitor you are using, in order to protect against mortgage fraud. Ask your solicitor if they can work with most lenders, and make sure they are a reputable firm.
Ensure your ID and address documents are up to date. Some mortgage lenders will ask you to provide proof of ID or address to satisfy money laundering requirements and these must be the original document, not a copy, and be current and valid.
Are you getting a joint mortgage? Think about how strong your relationship is with the other party. Changes to your relationship could make it hard if one party wishes to sell their part of the property.
What are your plans for the property over the next few years? Match your mortgage to your future plans. For example, avoid taking out a fixed rate mortgage if you plan to sell the property shortly after buying it. Many fixed rate mortgages charge a penalty if you pay them off before the end of the set period which can be expensive.
Are you eligible for the mortgage? Borrowers generally need to be over 18 years of age. There are other requirements too, but these depend on the lender. Some will want you to have a good credit rating. Others might not allow you to buy inner city apartments. Always read these conditions before applying.
What documents are required for a mortgage?
When you apply for a mortgage, your lender will want to see documents showing proof of your identity, your address and your spending habits. Find out what documents you need below.
Utility bills
P60 form from your employer
Payslips
Passport or driving licence
Bank statements
Credit file
Deposit finances
Struggling to understand mortgage jargon?
We know that sometimes it seems as though the financial world operates in a different language altogether, making it hard to understand what you’re getting into when applying for a mortgage. So to help you out, we have created a mortgage A-Z to simplify the terms you’re most likely to come across in your application.
And here, at a glance, are the terms found in our comparison table above:
Initial rate. The interest rate charged for the introductory period of your mortgage deal – for example, the first 2, 3 or 5 years.
Revert rate (SVR). This is the standard variable rate that you will switch to after your initial rate ends.
Maximum LTV. This is the maximum loan-to-value ratio that the provider will lend on e.g. if you had a 10% deposit, the LTV of your mortgage would be 90%.
Overall cost for comparison. This is indicated using the APRC, which stands for annual percentage rate of charge. Assuming you kept the same mortgage for its whole term (e.g. 25 years), the APRC shows how much your mortgage would cost each year as a percentage of the overall loan, factoring in any fees and a switch to the standard variable rate.
Estate agent fees: Learn how much you should pay
A good estate agent can be a valuable asset when you’re selling your home. An agent who knows the market, understands how to advertise your home and has a good network of potential buyers can ensure you get the best price possible for your property. However, this service doesn’t come for free.
Before you decide whether or not to employ a estate agent, it’s important to understand how much it will cost and what you’ll be getting for your money. Use our calculator to how much in fees you may need to pay:
Estate agent fees calculator
Complete the fields to calculate how much fee you will pay. In our calculations we include an additional 20% VAT charge based on the agent's fee.
Complete the fields above to calculate how much fee you will pay.
How much do agents charge?
In general, agents will charge for their services using one of the following structures:
Commission. An agent’s commission is calculated as a percentage of the home’s final sale price and are subject to VAT. Currently estate agent fees are often between 1% and 3% of the sale price depending on the size of the property and the location it’s in. On average, estate agent fees are about 1.18%+VAT.
Fixed fee. Some agents will agree to a fixed fee rather than a commission based on a percentage of the sale price. The benefit of this model is it provides certainty around the price you’ll pay to sell your house. You’ll know ahead of time exactly the amount you’ll be paying your agent, regardless of the sale price. Of course the drawback is that a flat fee might not motivate your agent to get the best price possible for your property. An agent negotiating a flat fee could prioritise a quick sale over receiving the highest price.
Multi-agency agreement. In a multi-agency agreement you have several agents working to sell your property. However, it’s the agent that is successful in making a sale that receives the commission. In most cases this kind of agreement means you’ll pay a higher fee – between 2% and 3% of the final sale price.
How to compare mortgages
The introductory rate is one of the most important factors to consider when comparing mortgages, but it doesn’t tell the whole story. Here are some other elements to take into account.
Term length.Fixed-rate mortgages with longer terms have higher rates, but you’ll be protected against potential rate rises for longer. It’s often recommended to apply for short-term mortgages and remortgage once the introductory term ends, but there’s no guarantee you’ll be in a financial position to be approved for a remortgage at that time, which is another reason why some people prefer the security of long-term mortgages.
Fees. Most mortgage products will have one-off fees attached to them. These should be considered as well as the interest rate. The best way to compare mortgages is to calculate the total amount you’ll spend during the introductory term. The main fees to look out for are an “arrangement” or “product” fee, and a “valuation” fee. These often adds up to several hundred pounds, even though some mortgage products don’t include them at all. Some lenders will give you the option to add any fees onto the mortgage, but this should be avoided whenever possible, as it will mean paying interest on them for the entirety of your mortgage term.
SVR (standard variable rate). This is the rate you’ll be switched onto after the introductory rate ends. It’s best to remortgage before you’re moved on to this significantly higher rate, but that’s not always possible, so it’s worth bearing this rate in mind.
Total repayable. This is the total amount you’ll owe over the length of your mortgage. This won’t be too important if you’re planning to remortgage after the introductory term ends, but it’s still a useful figure to help you compare products. The easiest way to reduce your total repayable is to cut the length of your mortgage. Your monthly repayments will be higher, but the amount of interest paid will drop significantly.
LTV (loan-to-value). This is the amount of money you’re borrowing from your lender, expressed as a percentage of your property value. With a higher deposit, you’ll be able to access mortgages with a lower LTV ratio. These mortgages have lower rates, plus you’ll pay less interest in total.
To illustrate this point, our box below shows two scenarios for a property costing £250,000. In the case where the property is purchased using a 20% deposit, the LTV on the mortgage would be 80%. The buyer secures a better interest rate (2.20% in this theoretical example), resulting in a monthly repayment of £867. They are paying £366 less per month than in the second scenario, where the property is bought with a 5% deposit, meaning a LTV ratio of 95%.
Property cost: £250,000
20% deposit = £50,000 (loan amount of £200,000)
Interest rate: 2.20%
Loan term: 25 years
Monthly repayments: £867
Property cost: £250,000
5% deposit = £12,500 (loan amount of £237,500)
Interest rate: 3.84%
Loan term: 25 years
Monthly repayments: £1,233
When comparing mortgages, you might find it works out cheaper to select a mortgage with a higher interest rate but no arrangement fee, rather than one that charges the lowest interest rate but has an arrangement fee of £2,000. Always calculate the total cost over the initial period to check you’re choosing the best deal.”
Largest lenders by market share
Mortgage lender
Market share
Lloyds Banking Group
15.6%
Nationwide Building Society
14.4%
Royal Bank of Scotland
12.9%
Santander UK
10.4%
Barclays
8.4%
HSBC Bank
6.4%
Coventry Building Society
3.7%
Virgin Money
3.4%
Yorkshire Building Society
2.9%
TSB
2.7%
These figures are taken from UK Finance (formerly the Council of Mortgage Lenders) and are based on gross lending amounts.
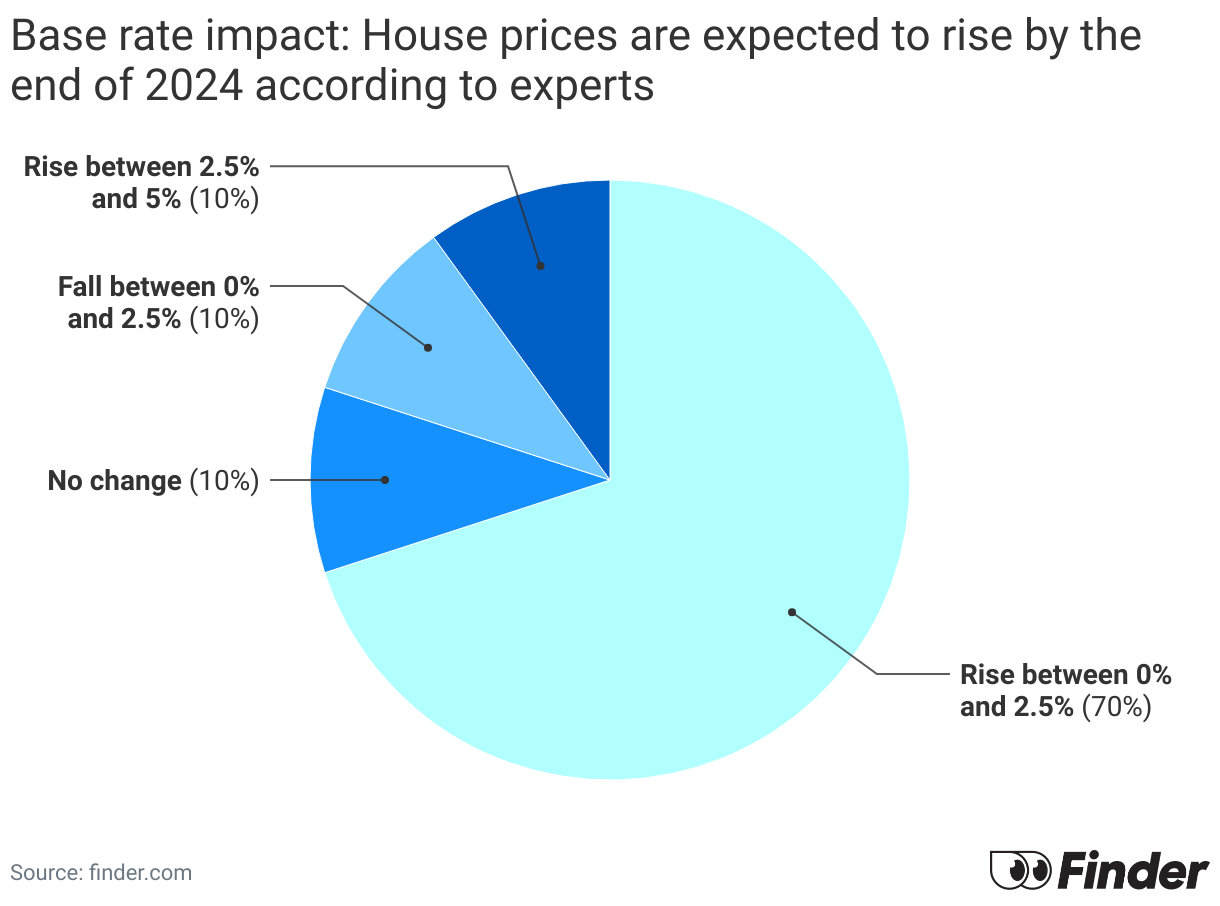
How much do you think house prices will change between now and the end of 2024?
Finder brought together an expert panel of academics, economists, mortgage experts and savings experts, asking them for a range of predictions and opinions on what will happen with the base rate.
According to the panel, 70% of experts believe that house prices will rise between 0% and 2.5% by the end of 2024.
10% of the expert panel expects prices will rise even further than this, increasing between 2.5% and 5% by the end of the year. A further 10% think house prices will fall between 0% and 2.5% and 10% do not think house prices will have changed by the end of 2024.
The amount of money you can borrow for a mortgage depends on your choice of mortgage provider and your personal circumstances. If you have a large deposit and are deemed a responsible borrower, you’ll often be approved to borrow more. However, most mortgage lenders will allow you to borrow no more than 4 to 5 times your annual income.
You can apply for a mortgage by contacting a mortgage lender. This can be done directly, perhaps by visiting a local branch, calling or finding a lender online. Alternatively, you can use a mortgage broker to apply on your behalf.
Your interest rate determines the monthly interest you’ll pay on your mortgage balance. Typically, your mortgage will include an introductory rate for the first few years, which converts to a higher standard-variable rate thereafter.
A mortgage in principle is a guarantee issued by a mortgage lender, stating that it will lend a specific amount of money once you find a property. However, this agreement typically only lasts 90 days and your property will have to pass your lender’s checks.
If you’re planning to move house, you’ll need to notify your mortgage provider. It may be able to port your mortgage onto the new property. If not, you’ll need to remortgage before you move.
If you have a student loan, as long as you can prove you’ll be able to pay off the mortgage you’re applying for, you shouldn’t have to worry about it scaring off any providers.
However, there are various ways that you can increase your chances, like fixing your credit history and paying off your most expensive debts first, so be sure to follow the advice in this guide. And check out our multiple mortgage lender reviews to search for one that suits you best.
We asked some of the UK’s major mortgage lenders about their policies on mortgage applicants with student loan debt. Here is what they told us.
Provider
What it told us
Compare
Barclays
Applicants still paying off their student debt are acceptable.
Most lenders allow you to extend your mortgage offer if needed, but aren’t actually obliged to offer an extension. If you’re nearing completion but delayed, let your lender know as soon as possible, typically weeks before your offer expires.
If your mortgage lender doesn’t extend your offer, you’ll need to re-apply. This means that you’ll have to pay for another valuation on the property, you may lose the solicitor’s fees and anything else you’ve spent so far trying to secure your new home.
If you use an authorised overdraft, this has no negative impact on your credit score, so it’s unlikely to have a huge influence on your mortgage application. However, if you’re habitually using it, then it may count against you in terms of affordability.
In other words, the bank will see it as a financial commitment that needs honouring. Regularly paying interest on overdraft borrowing may mean (at least in a lender’s eyes) that there’s less money left over each month to cover a mortgage payment. For this reason, you may opt to clear your overdraft before applying for a mortgage.
Unauthorised overdraft use will leave a black mark on your credit score for several years and could serverely hamper your chances of being approved for a mortgage.
If you’re looking for an overseas home to enjoy your holidays in, you’ll be pleased to hear it’s simple enough to arrange an overseas mortgage.
Most of the processes and eligibility checks are the same as when buying a home in the UK, although you may face a different set of fees and charges. The way you pay your taxes will differ slightly too.
The biggest decision you’ll need to make is whether to use a UK or overseas lender.
There are plenty of UK lenders that are happy to arrange a mortgage on an overseas property, although it’s common to get a better deal using a mortgage provider from the country where you’re buying a home.
The price of a fixed rate mortgage is determined by lots of factors. While the pricing for a variable rate mortgage relies on the base rate, lenders have to consider more factors to set the price of fixed rate mortgages.
Here are all the factors lenders use to set their fixed mortgage rates:
Base rate. This is the factor that dominates the headlines, especially when there’s a change. However, the Bank of England base rate – or bank rate – doesn’t have as direct an impact on fixed rate mortgage pricing as some of us may think.
Retail savings. Banks need funding in order to lend. One of the major ways they get funding is through “retail deposits” (money you put in your bank account) from consumers and small companies. The level of retail savings a bank has will determine how much it can lend and at what price.
Wholesale funds Wholesale funding is used if a bank wants to borrow more than what it has in retail deposits. It can borrow from other banks or financial institutions, or it can use its assets as collateral and borrow funds from investors.
Swap rates. The swap rate is the secret factor that actually drives the pricing. Swap rates are what lenders pay to financial institutions to get fixed funding for a set period. It’s based on what the markets think interest rates will be over the term of the swap rate. If there’s a rise in swap rates, lenders will increase their pricing to maintain their profit margin. If they rise too rapidly, lenders tend to pull products and wait until swap rates have stabilised. Typically, it’s also why any increase in the base rate won’t have an immediate effect on fixed mortgage rates. This is because swap rates are based on assumptions of what interest rates will be, so the base rate rise or fall will have already been priced into the mortgage rates.
Representative example A mortgage of £230,537 payable over 23 years, initially on a fixed rate until 31/01/28 at 3.99% and then on a variable rate of 6.49% for the remaining 21 years would require 24 payments of £1,277.66 followed by 252 payments of £1,585.00. The total amount payable would be £430,099 made up of the loan amount plus interest (£199,547) and fees (£15). The overall cost for comparison is 6.1% APRC representative.
We show offers we can track - that's not every product on the market...yet. Unless we've said otherwise, products are in no particular order. The terms "best", "top", "cheap" (and variations of these) aren't ratings, though we always explain what's great about a product when we highlight it. This is subject to our terms of use. When you make major financial decisions, consider getting independent financial advice. Always consider your own circumstances when you compare products so you get what's right for you. Most of the data in Finder's comparison tables is provided by Defaqto. In other cases, Finder has sourced data directly from providers.
Sources
Was this content helpful to you?
Thank you for your feedback!
To make sure you get accurate and helpful information, this guide has been reviewed by
Rachel Wait, a member of Finder's
Editorial Review Board.
Emily Herring is a Publisher at Finder specialising in credit-based products including credit cards and business and personal loans. Emily has recently joined the Investments team. She has a Masters in Creative Writing & Publishing and a Bachelor of Arts in Communication & Media.
See full bio
Emily's expertise
Emily
has written
101
Finder guides across topics including:
Matthew Boyle is a banking and mortgages publisher at Finder. He has a 7-year history of publishing helpful guides to assist consumers in making better decisions. In his spare time, you will find him walking in the Norfolk countryside admiring the local wildlife.
See full bio
Matthew's expertise
Matthew
has written
214
Finder guides across topics including:
Helping first-time buyers apply for a mortgage
Comparing bank accounts and highlighting useful features
Finder.com is an independent comparison platform and information service that aims to provide you with the tools you need to make better decisions. While we are independent, the offers that appear on this site are from companies from which Finder receives compensation. We may receive compensation from our partners for placement of their products or services. We may also receive compensation if you click on certain links posted on our site. While compensation arrangements may affect the order, position or placement of product information, it doesn't influence our assessment of those products. Please don't interpret the order in which products appear on our Site as any endorsement or recommendation from us. Finder compares a wide range of products, providers and services but we don't provide information on all available products, providers or services. Please appreciate that there may be other options available to you than the products, providers or services covered by our service.
We update our data regularly, but information can change between updates. Confirm details with the provider you're interested in before making a decision.
How likely would you be to recommend Finder to a friend or colleague?
0
1
2
3
4
5
6
7
8
9
10
Very UnlikelyExtremely Likely
Required
Thank you for your feedback.
Our goal is to create the best possible product, and your thoughts, ideas and suggestions play a major role in helping us identify opportunities to improve.