Finder makes money from featured partners, but editorial opinions are our own.
Advertiser disclosure
Number of people who shop at work
Work hard or hardly working? 57% of American workers admit to online shopping while at work.

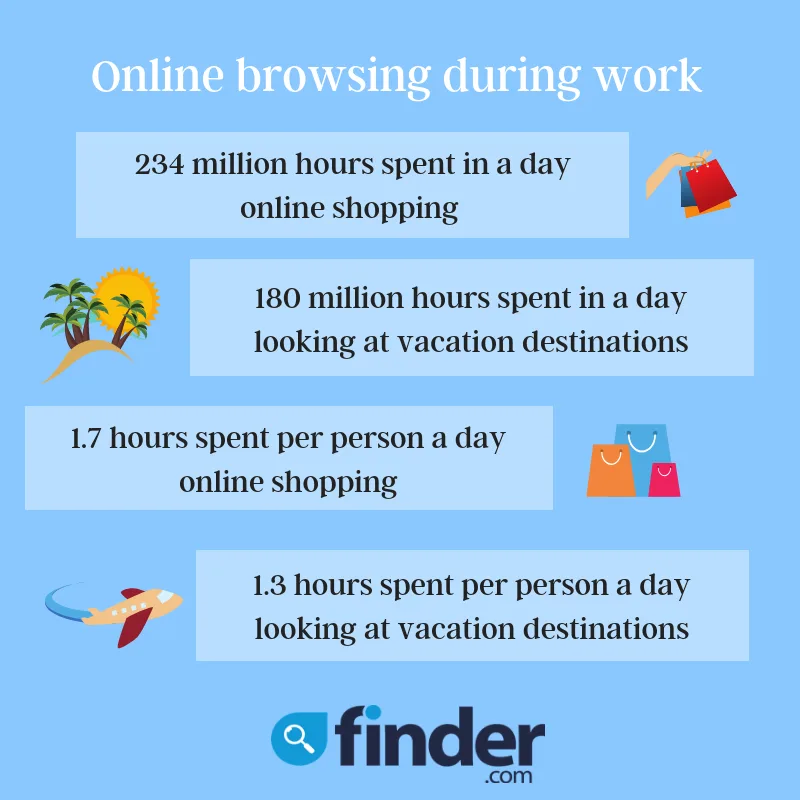
We’ve all been there: bored at work, we Alt + Tab from a spreadsheet to something more fun, like buying new shoes or clicking through photos of Tahitian beaches. If that sounds familiar, it’s because you’re not alone, with roughly 140 million Americans confessing to online shopping at work (57%), totaling some 234 million hours a day browsing online, according to recent finder.com survey data.
Online browsers share the same two guilty pleasures while on the clock: online shopping and searching for our next vacation.
Of the 140 million Americans who shop the Internet each day from their work desks, 46% spend roughly half an hour online weekly looking for deals, with another 19% spending up from 30 minutes to an hour and 17% spending from one to two hours a week online shopping from the office. Interestingly, a whopping 1.4 million (1%) American adults spend 20-plus hours — or at least half the workweek — online shopping from their desks.
| Time spent | % of people |
|---|---|
| 0 to 30 minutes | 46% |
| 30 minutes to 1 hour | 19% |
| 1 hour to 2 hours | 17% |
| 2 hours to 5 hours | 11% |
| 5 hours to 10 hours | 4% |
| 10 hours to 20 hours | 2% |
| 20+ hours | 1% |
Men (52%) are more likely than women (48%) to spend time shopping online while on the job. While women (50%) are more likely to spend up to 30 minutes a week shopping online than men (42%), men (21%) are more likely to spend from 30 minutes to an hour online than women (15%). Men are also three times as likely to spend from 10 to 20 hours online while at work: men (3%) versus women (1%).
| Time spent | % of women | % of men |
|---|---|---|
| 0 to 30 minutes | 50% | 42% |
| 30 minutes to 1 hour | 15% | 21% |
| 1 hour to 2 hours | 17% | 17% |
| 2 hours to 5 hours | 12% | 11% |
| 5 hours to 10 hours | 4% | 4% |
| 10 hours to 20 hours | 1% | 3% |
| 20+ hours | 1% | 1% |
Gen Y is the most likely of the generations to spend time shopping during their 9-to-5, with 29% admitting to spending at least half an hour online. Another 14% admit to 30 minutes to an hour, while 12% admit to spending from one to two hours browsing online for items.
Across the generations, 33% of baby boomers, 57% of Gen X and 71% of Gen Y admit to online shopping.
| Time spent | % of Baby boomers | % of Gen X | % of Gen Y |
|---|---|---|---|
| 0 to 30 minutes | 20% | 27% | 29% |
| 30 minutes to 1 hour | 5% | 10% | 14% |
| 1 hour to 2 hours | 3% | 11% | 12% |
| 2 hours to 5 hours | 4% | 6% | 9% |
| 5 hours to 10 hours | 0.4 | 2% | 3% |
| 10 hours to 20 hours | 0.2% | 0.48% | 2% |
| 20+ hours | 0.2% | 1% | 1% |
What else are we looking at while putting in our hours? Anywhere else we’d rather be, of course! Some 55% of American adults admit to online browsing for a destination or holiday during work hours. That’s an estimated 135 million adults who spend time at work browsing for vacation.
Collectively, Americans spend an estimated 180 million hours a day browsing the Internet for vacay spots. Roughly 57% of us spend up to half an hour a week browsing holiday locations, with 16% spending from 30 minutes to an hour and 13% spending from an hour to two hours each week at work, dreaming of their ideal day-off destination.
| Time spent | % of people |
|---|---|
| 0 to 30 minutes | 57% |
| 30 minutes to 1 hour | 16% |
| 1 hour to 2 hours | 13% |
| 2 hours to 5 hours | 8% |
| 5 hours to 10 hours | 4% |
| 10 hours to 20 hours | 1% |
| 20+ hours | 1% |
About 58% of working American men confess to shopping for a holiday or vacation spot while at work. Compare those guys with the 50% of women who say they do the same.
While women (60%) are more likely than men (54%) to spend up to half an hour looking for a travel destination while at work, men are more guilty than women of wasting 30 minutes or more narrowing down their next getaway.
| Time spent | % of women | % of men |
|---|---|---|
| 0 to 30 minutes | 60% | 54% |
| 30 minutes to 1 hour | 16% | 17% |
| 1 hour to 2 hours | 12% | 14% |
| 2 hours to 5 hours | 7% | 8% |
| 5 hours to 10 hours | 3% | 4% |
| 10 hours to 20 hours | 1% | 1% |
| 20+ hours | 1% | 1% |

Richard Laycock, Insights editor and senior content marketing manager


From knowing how much you have in savings to understanding the tax implications that come with investing.

You have so many banking options, so make sure yours offers the strongest perks.

