Qualifying as a SmaRT provider is not always possible
- In Q3 2016, 54 of the 365 corridors had less than 3 qualifying providers
- In Q3 2016, 9 of the 365 corridors did not have any because they did not meet access criteria
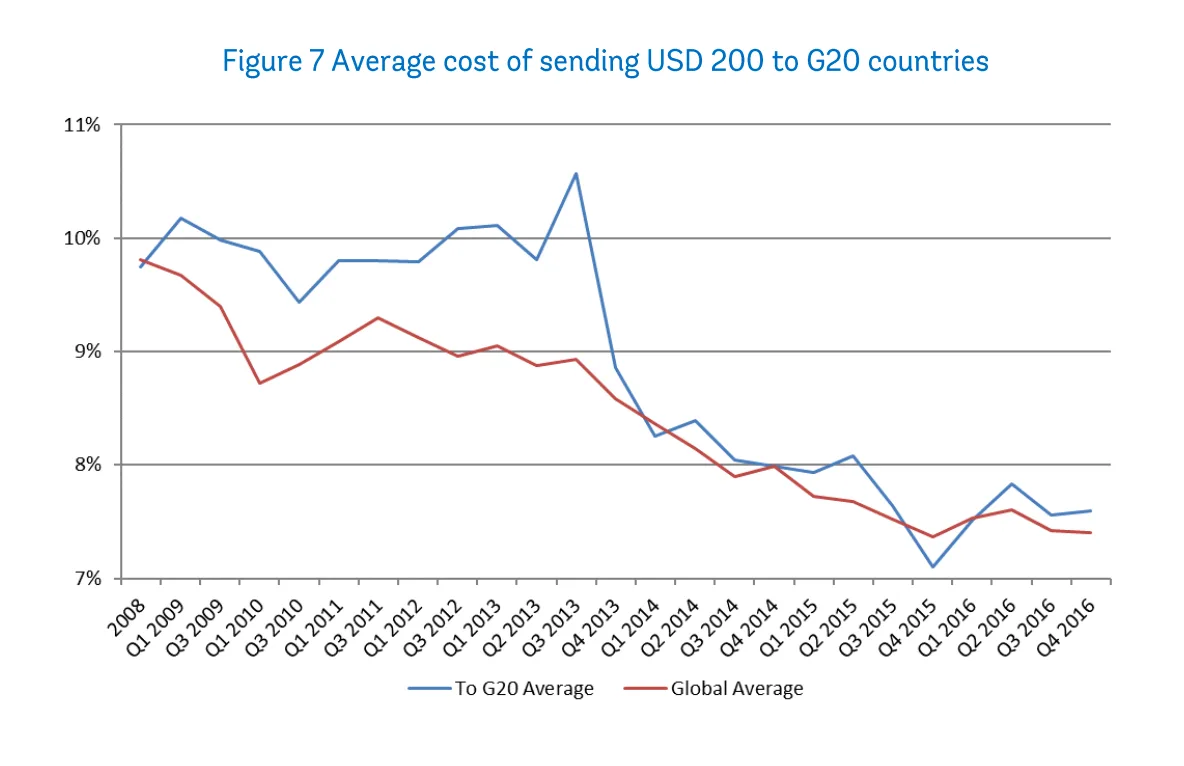
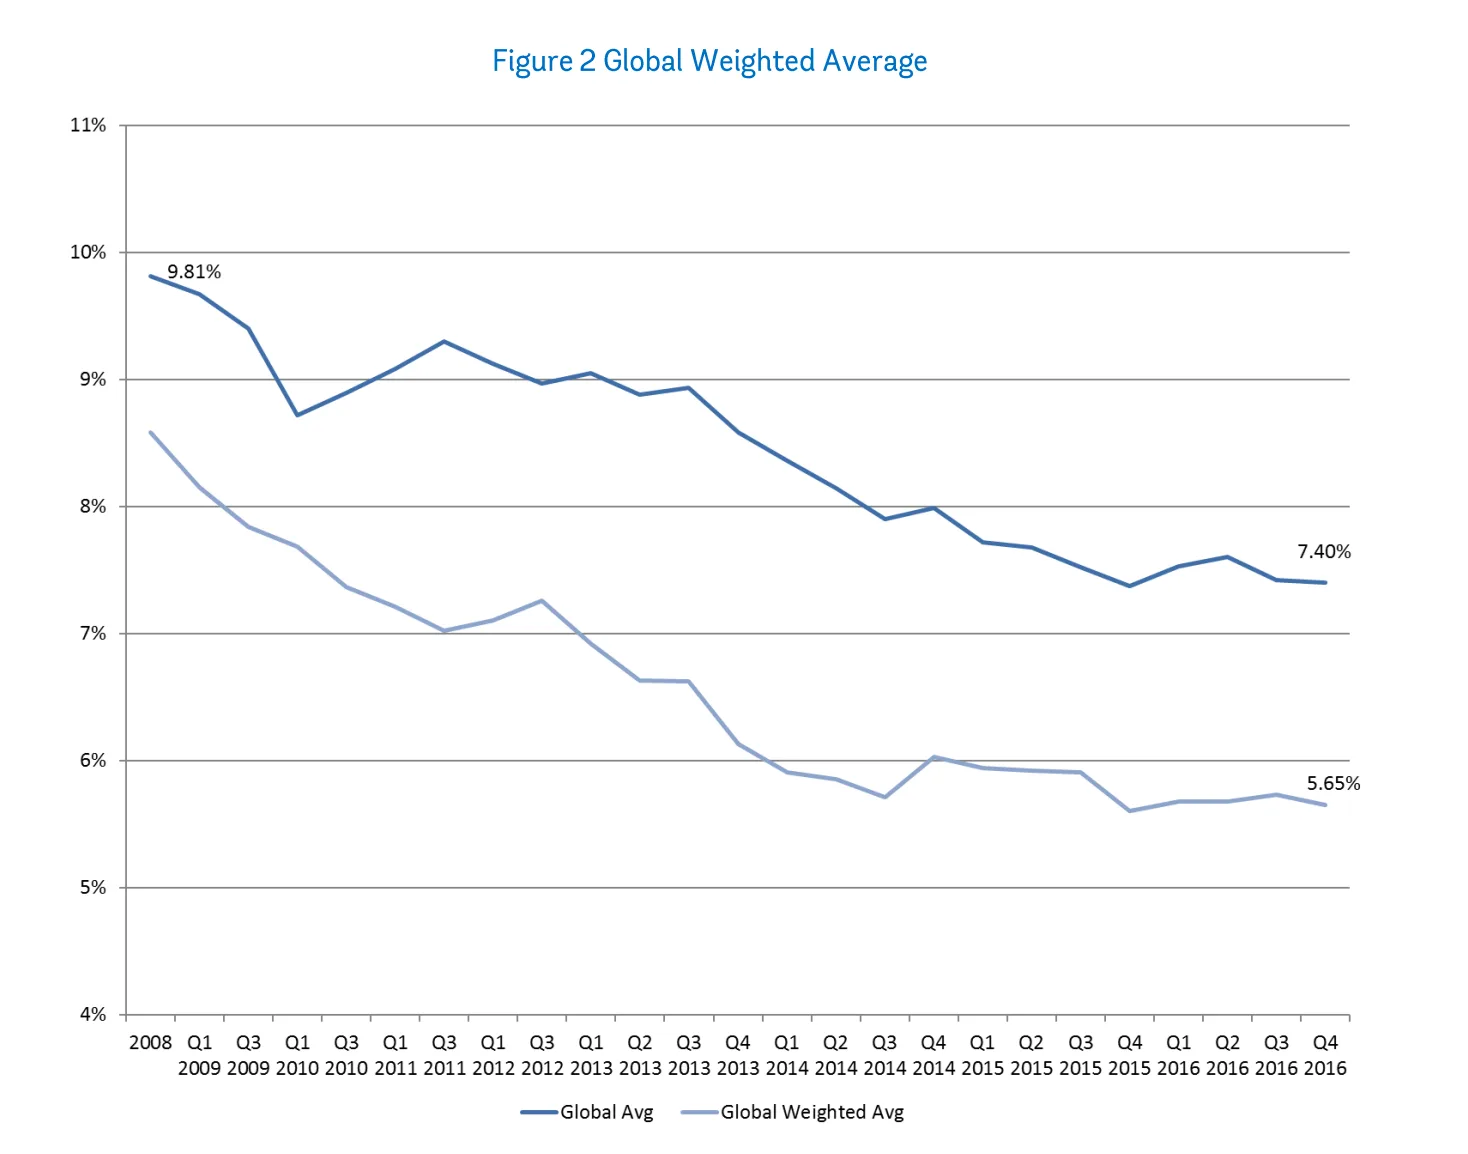
According to the World Bank, 574 Billion USD was sent in remittances globally in 2016. But how much is taken out in fees for sending this money? The global average rate for sending $200 was 7.14% as of Q3 of 2017. This has gone down by 1.47% from Q2 and 21.83% since Q3 2012.
| Period | Global average rate to send $200 | Percentage change |
|---|---|---|
| Q3 2017 | 7.14% | N/A |
| Q2 2017 | 7.25% | -1.55% |
| Q3 2012 | 9.10% | -21.55% |
While the global average rate is 7.14%, this rate will change depending on the country you are sending money to or from. This is due to regulations, taxes and international relations.
Select the relevant year/s you are interested in from the below filter on the right and hover over a country to see their historical rates. Values are averaged over the time period selected in the ‘Year’ filter.
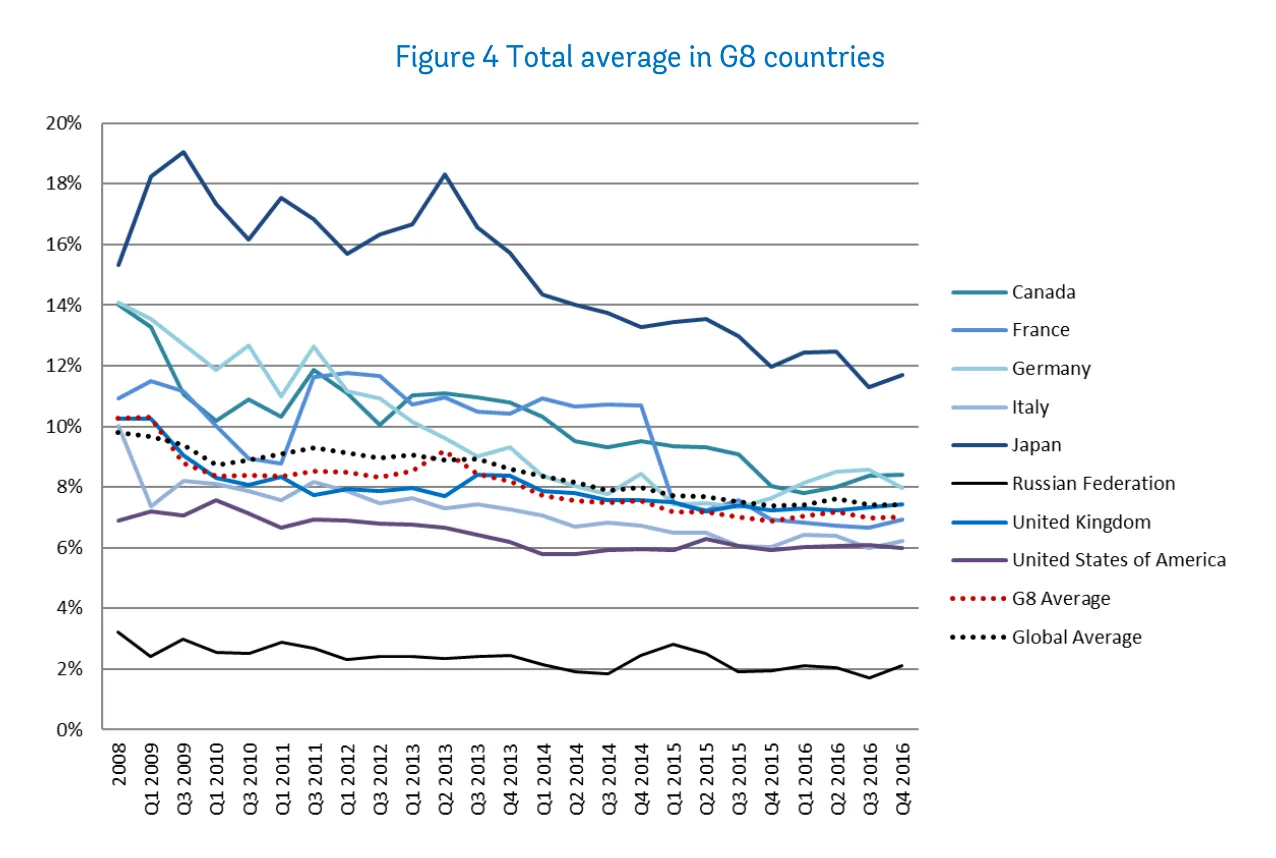
The below graph illustrates how the average rate of remitting from G8 countries have changed over time.
| Country | Q2 average rate | Q3 average rate | Percentage change |
|---|---|---|---|
| Russian Federation | 1.78% | 2.13% | 19.91% |
| United Kingdom | 7.58% | 7.04% | -7.08% |
| Country | Q3 2012 average rate | Q3 2017 average rate | Percentage change |
|---|---|---|---|
| France | 13.46% | 6.46% | -51.99% |
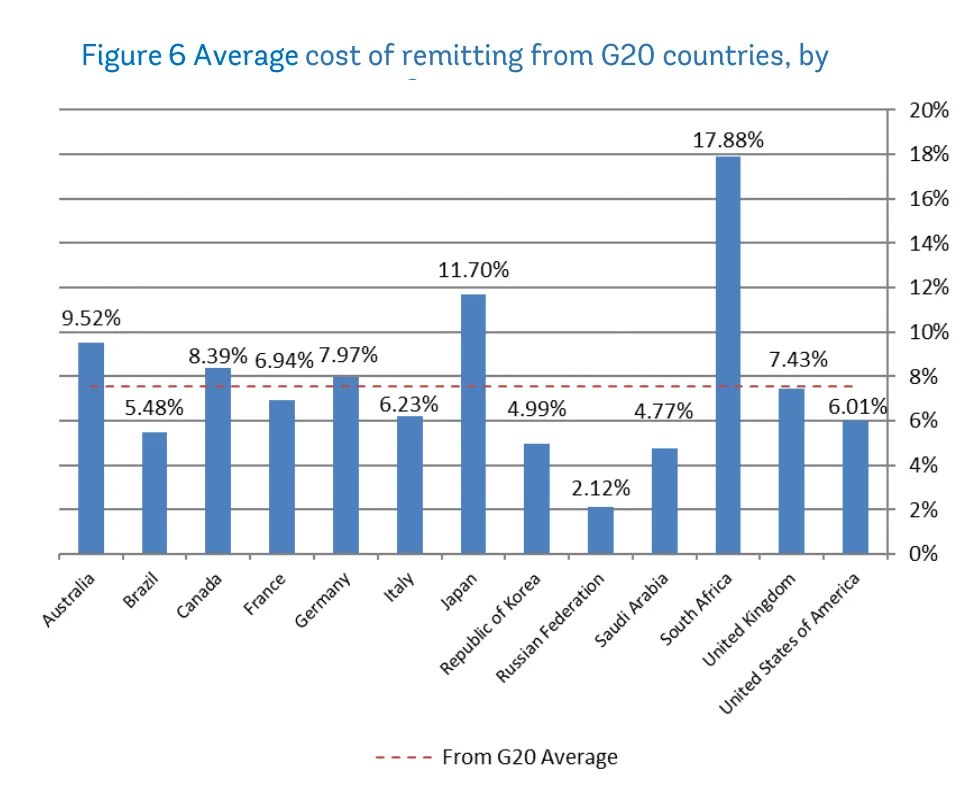
As of Q3 2017, the average fees for sending money from Australia, Canada, Germany, Japan and South Africa are above the global average.
Select the relevant period/s you are interested in from the below filter on the right. Values are averaged over the time period selected in the ‘Period’ or ‘Year’ filter.
| Country | Q2 average rate | Q3 average rate | Percentage change |
|---|---|---|---|
| Brazil | 3.47% | 4.64% | 33.70% |
| Korea, Rep. | 5.42% | 4.81% | -11.30% |
| Country | Q3 2012 average rate | Q3 2017 average rate | Percentage change |
|---|---|---|---|
| France | 13.46% | 6.46% | -51.99% |
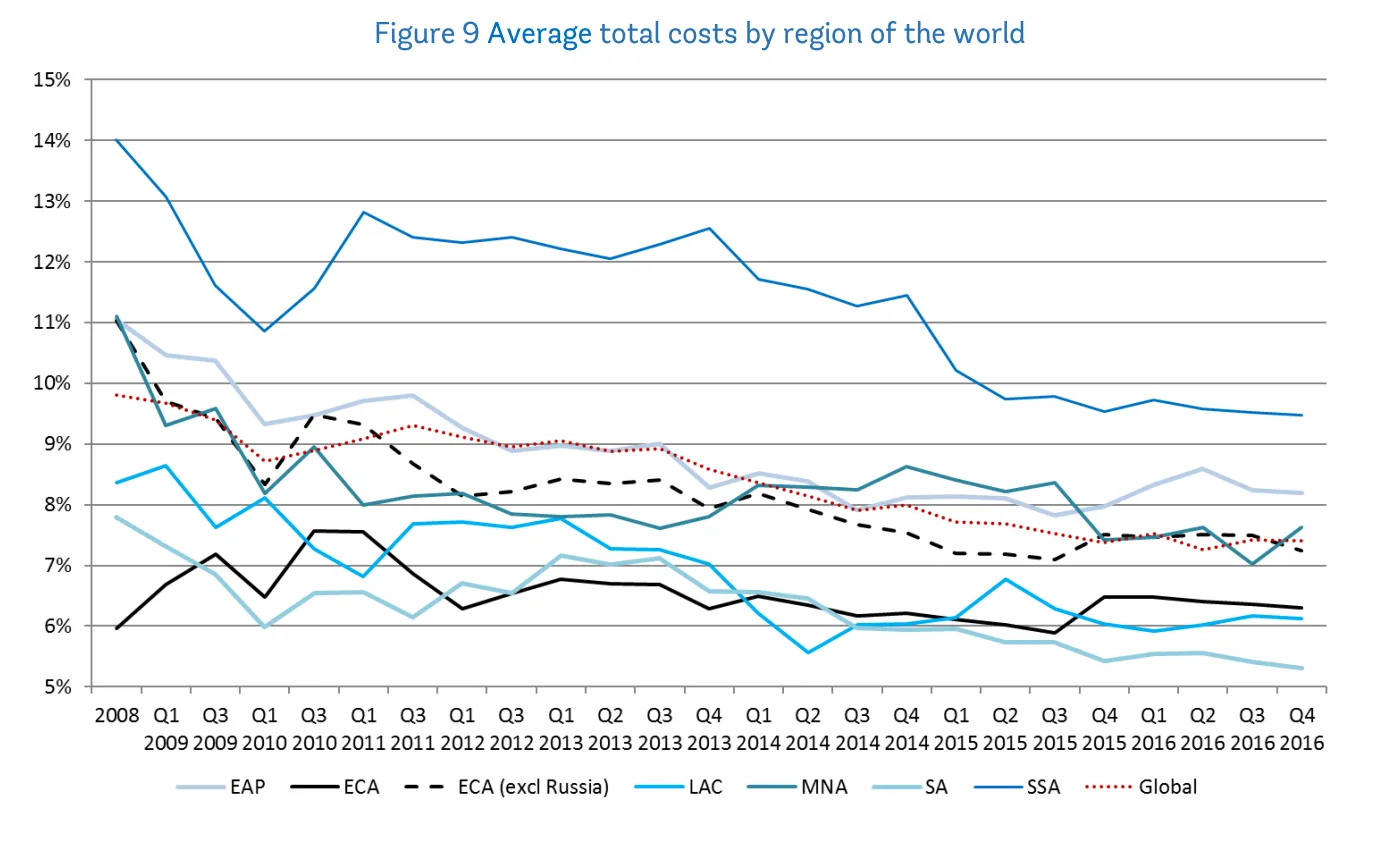
As of Q3 2017 the cheapest region to remit to is South Asia at an average rate of 5.45%. In contrast, the most expensive region is Sub-Saharan Africa at 9.12% whilst the global average is 7.14%.
| Region | Q2 average rate | Q3 average rate | Percentage change |
|---|---|---|---|
| Sub-Saharan Africa | 9.39% | 9.12% | -2.90% |
| Region | Q3 2012 average rate | Q3 2017 average rate | Percentage change |
|---|---|---|---|
| Latin America and Caribbean | 8.02% | 5.81% | -27.60% |
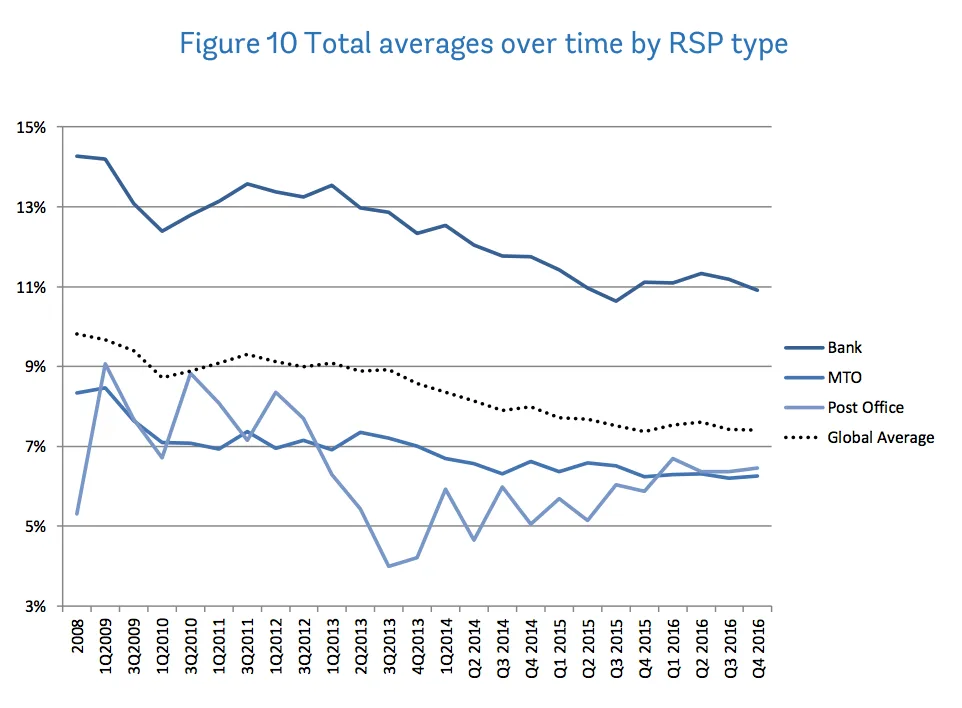
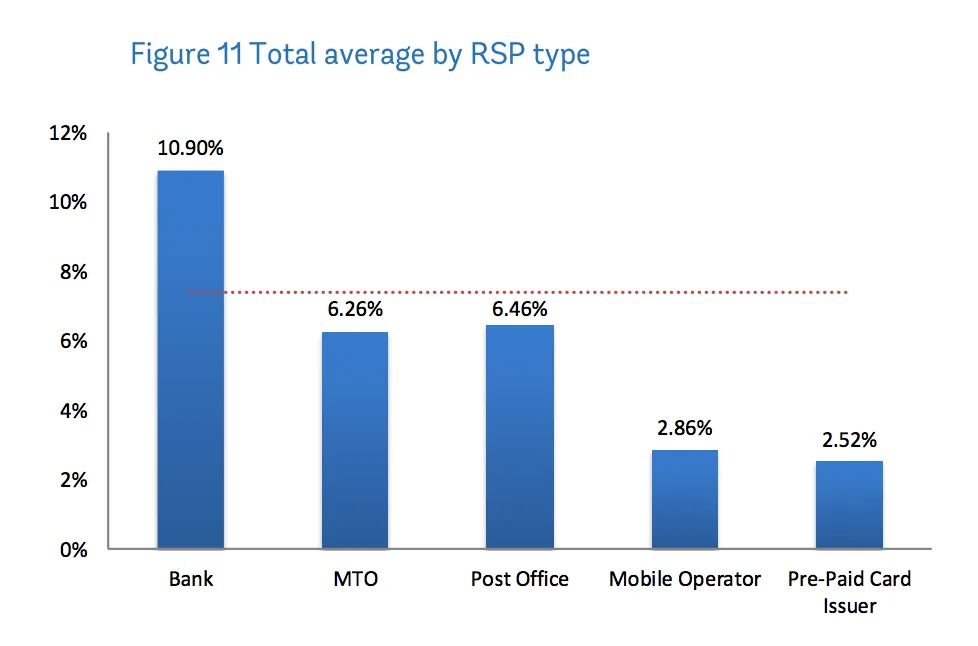
Banks are and have always been by far the most expensive method to remit money compared to money transfer operators (MTO) and post offices when comparing Remittance Service Providers (RSP). Even so, we have seen bank rates decrease over the last few years. On the other hand, post office rates have been increasing.
| RSP | Q2 average rate | Q3 average rate | Percentage change |
|---|---|---|---|
| Bank | 10.84% | 10.82% | -0.17% |
| MTO | 6.26% | 6.16% | -1.58% |
| Post office | 5.84% | 5.48% | -6.20% |
| RSP | Q3 2012 average rate | Q3 2017 average rate | Percentage change |
|---|---|---|---|
| Bank | 13.53% | 10.82% | -20.03% |
| MTO | 7.21% | 6.16% | -14.51% |
| Post office | 5.45% | 5.48% | 0.60% |
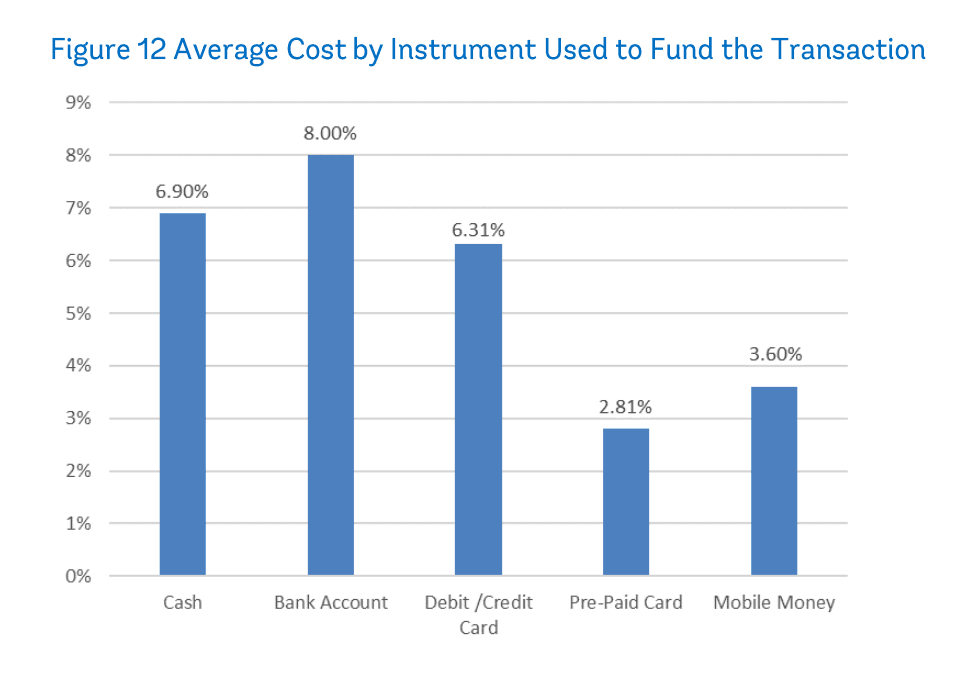
The average cost of remitting money from a bank account is currently 8.56% as of Q3 2017. This is the only method above the global average of 7.14%.
| Method | Q2 2017 average rate | Q3 2017 average rate | Percentage change |
|---|---|---|---|
| Cash | 6.92% | 6.99% | 1.00% |
| Prepaid card | 3.82% | 3.65% | -4.50% |
| Method | Q3 2012 average rate | Q3 2017 average rate | Percentage change |
|---|---|---|---|
| Prepaid card | 2.20% | 3.65% | 65.70% |
| Mobile money | 4.72% | 3.55% | -24.80% |
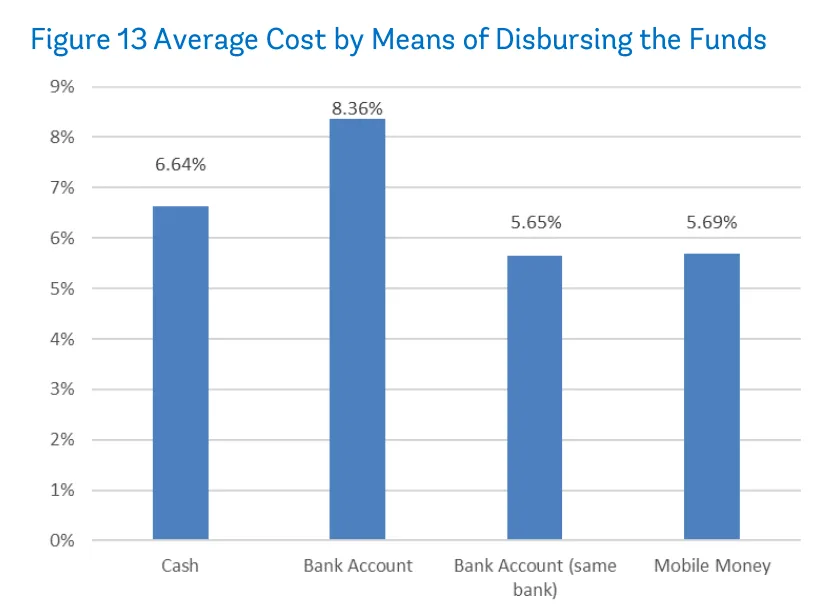
The average cost of receiving funds from a bank account from 2011 to Q3 2017 is once again the most expensive method at 10.99%.

Richard Laycock, Insights editor and senior content marketing manager


There’s no true free B2B international money transfer service, but some are cheaper than others. See a side-by-side comparison of cost-effective options.
Transfer agents, mobile wallets and online credit card payments don’t necessarily require a bank account.
Learn how to take advantage of door-to-door cash by getting money delivered directly to your home or recipient’s doorstep.
Enjoy cheap currency exchange rates with CurrencyFair, a peer-to-peer provider with 20 available currencies.
We compare two big names in international money transfers to see who is cheaper and faster.
Western Union’s extensive global network comes with high fees and weak exchange rates, use these alternatives to look for a better deal.
Compare MoneyGram with competitive alternatives to find the best deal for your transfer.
From bank transfers to specialist money transfer companies, there are several options available when you need to transfer money overseas from your bank account.
We dive deep into OFX, looking at everything from supported currencies to customer service.
Xe is a leading company of currency solutions and it offers competitive international money transfer options to individuals and businesses around the world.